Can Lake Berryessa Flood Over the Dam?
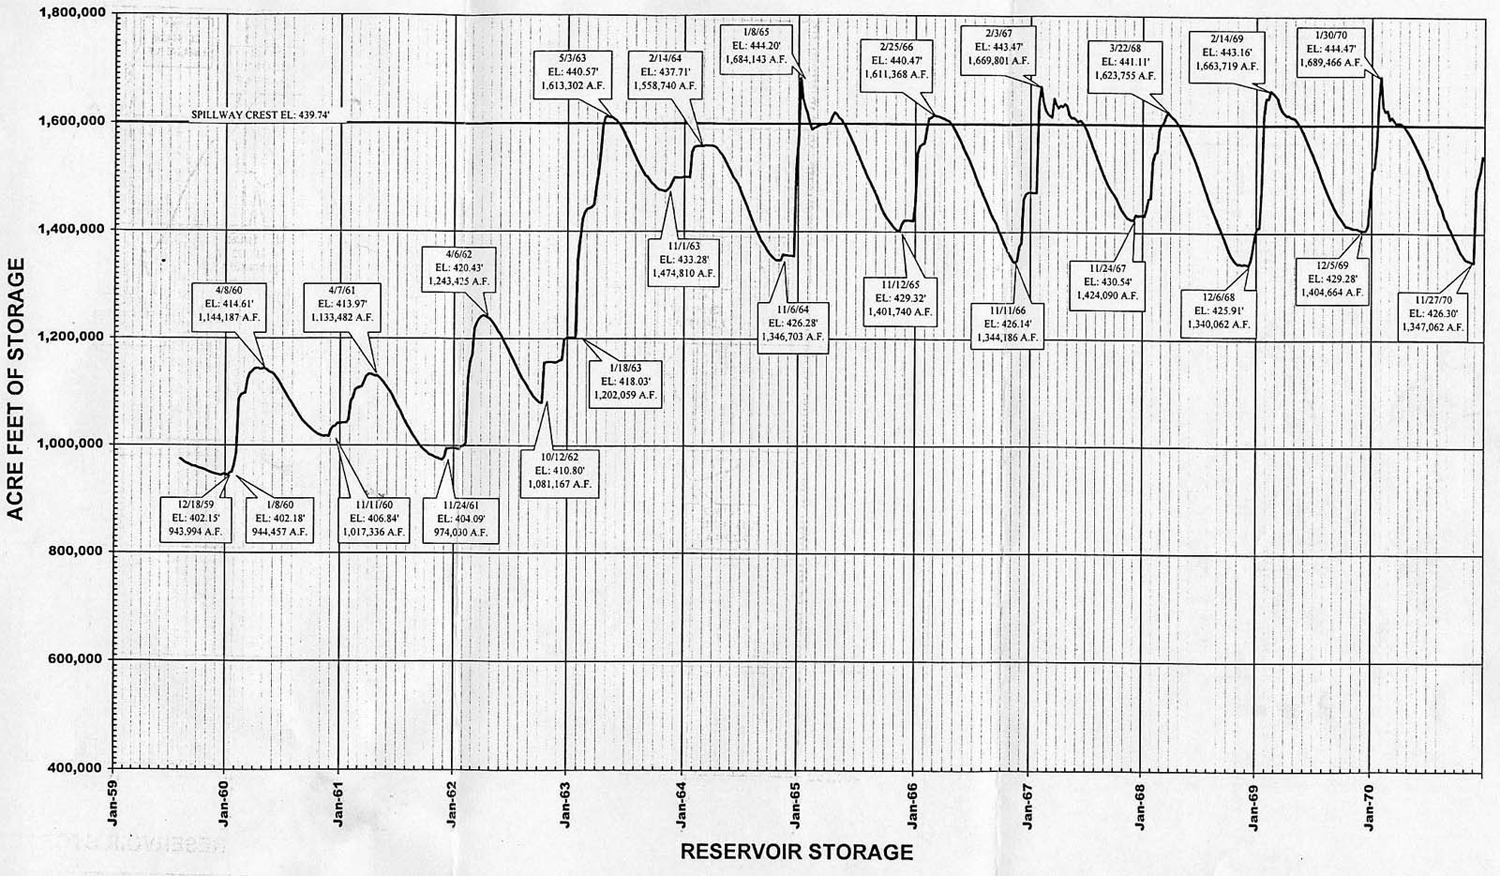
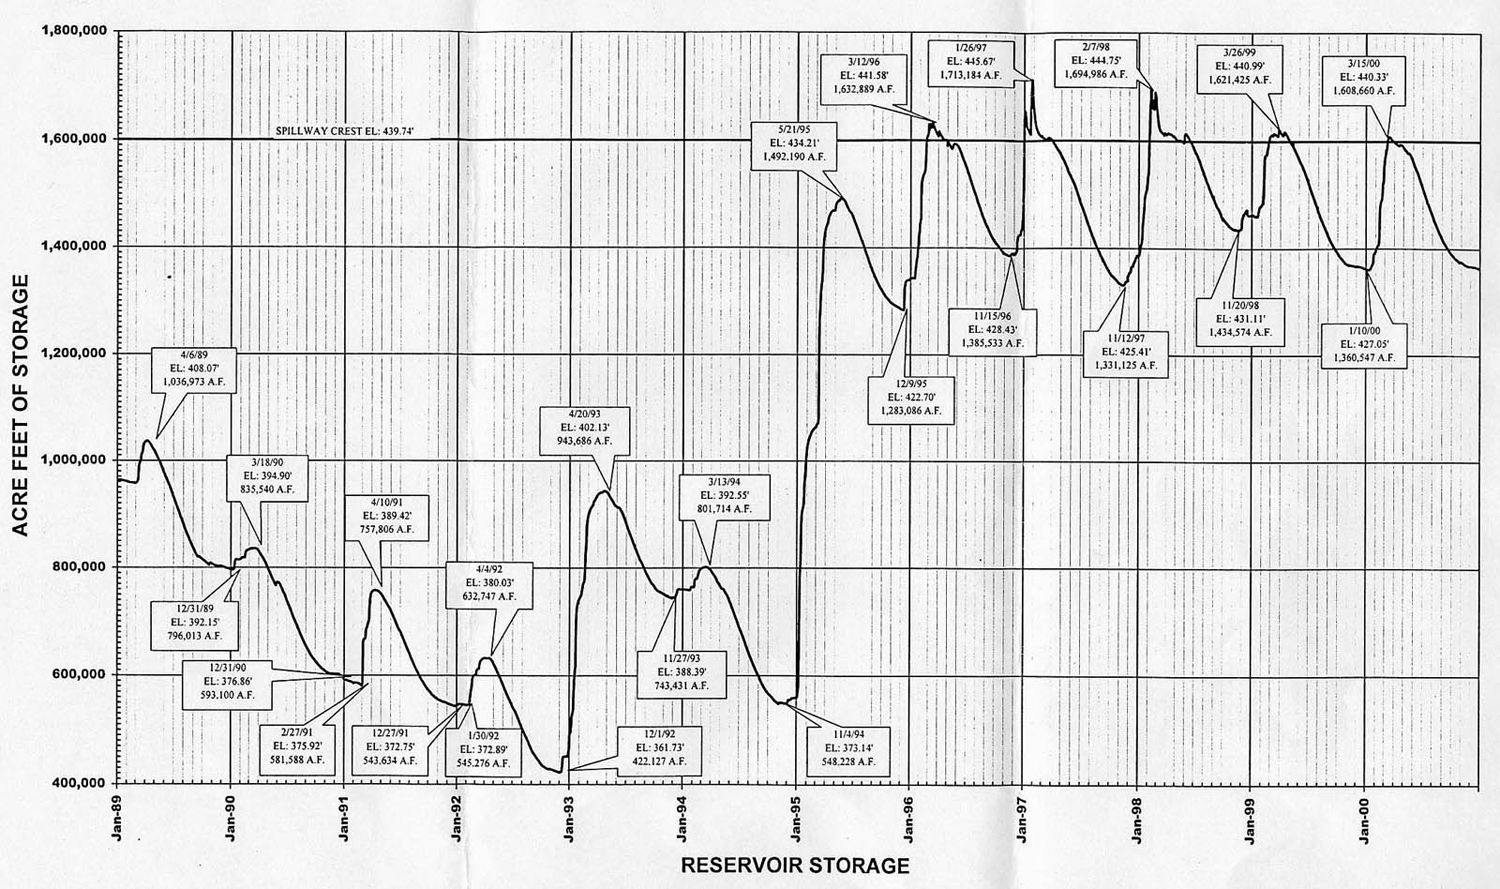
Not very likely. The lake level has never been higher than 446.7 feet (1983) since the dam was constructed. Since 1985 it has only reached 444 feet once in 1998. It is typically at or below 440 feet (Glory Hole). The master charts below show that the lake has reached 440 feet only twenty-seven times in its 64-year existence.


The above master charts need a bit of explanation. Although consistently accurate rainfall data at Monticello Dam is not available before 1998 and the lake level measured in feet above mean sea level (MSL) only exists after 1998, the Bureau of Reclamation has been keeping detailed data on lake capacity measured in acre-feet since the dam was constructed.
Although the charts below are in acre-feet, each of the peaks and valleys has a text box with the date, level in feet above msl, and capacity in acre-feet. This allows a correlation between acre-feet and lake elevation and is how the elevation levels were derived for the master charts above. The first chart documents the original filling of the lake. The second chart shows the levels and capacity during the drought of the early 1990s.
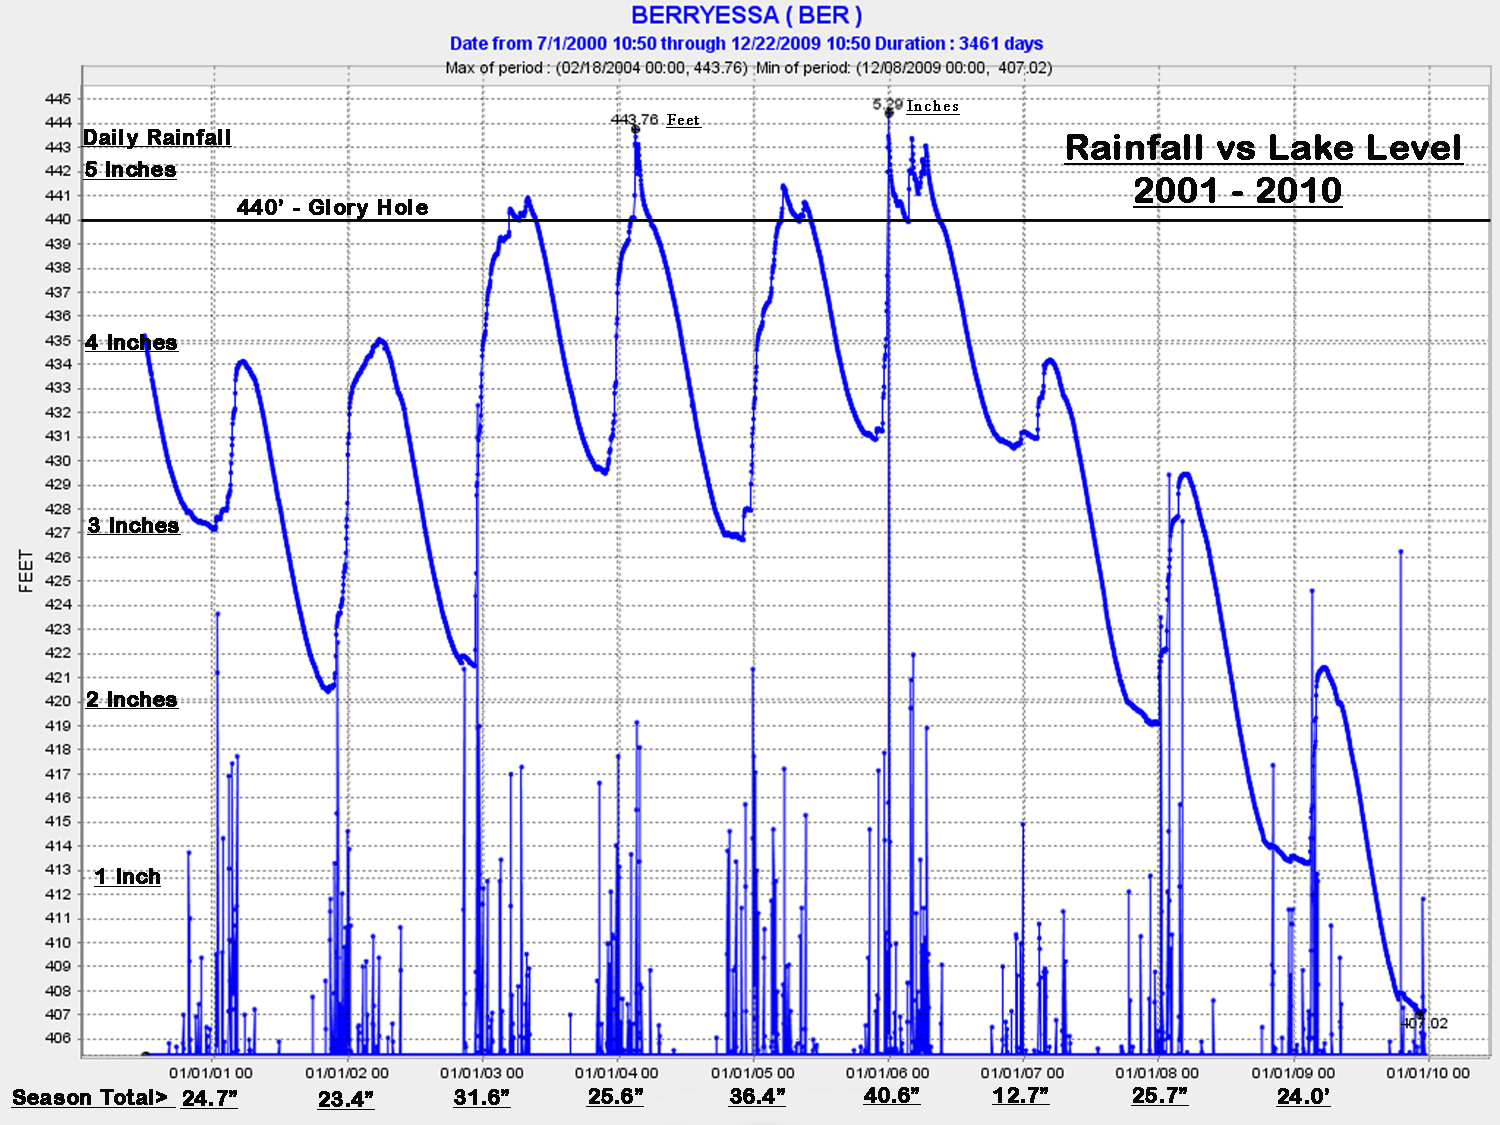
The early 1980s had mostly above average in precipitation in northern California and throughout the West, with the wettest year of the decade occurring in 1983 – also the highest level the lake ever reached, 446.7 feet, almost 7 feet above Glory Hole! The rainfall versus lake level chart below gives daily and annual rainfall totals versus lake levels for the 2000 to 2008 seasons.
According to the Bureau of Reclamation, droughts are a significantly higher risk than floods since this is a reservoir which has some control over outflow rates but must provide water by law even if there is low rainfall. There is only a 1 in 100 chance that there will be a flood level up to 450 feet. The top of the dam is at 455 feet. Highway 128 was designed to be the emergency spillway before the lake overtops the dam. Economic impacts due to potential floods are a very low probability and thus a low planning priority.
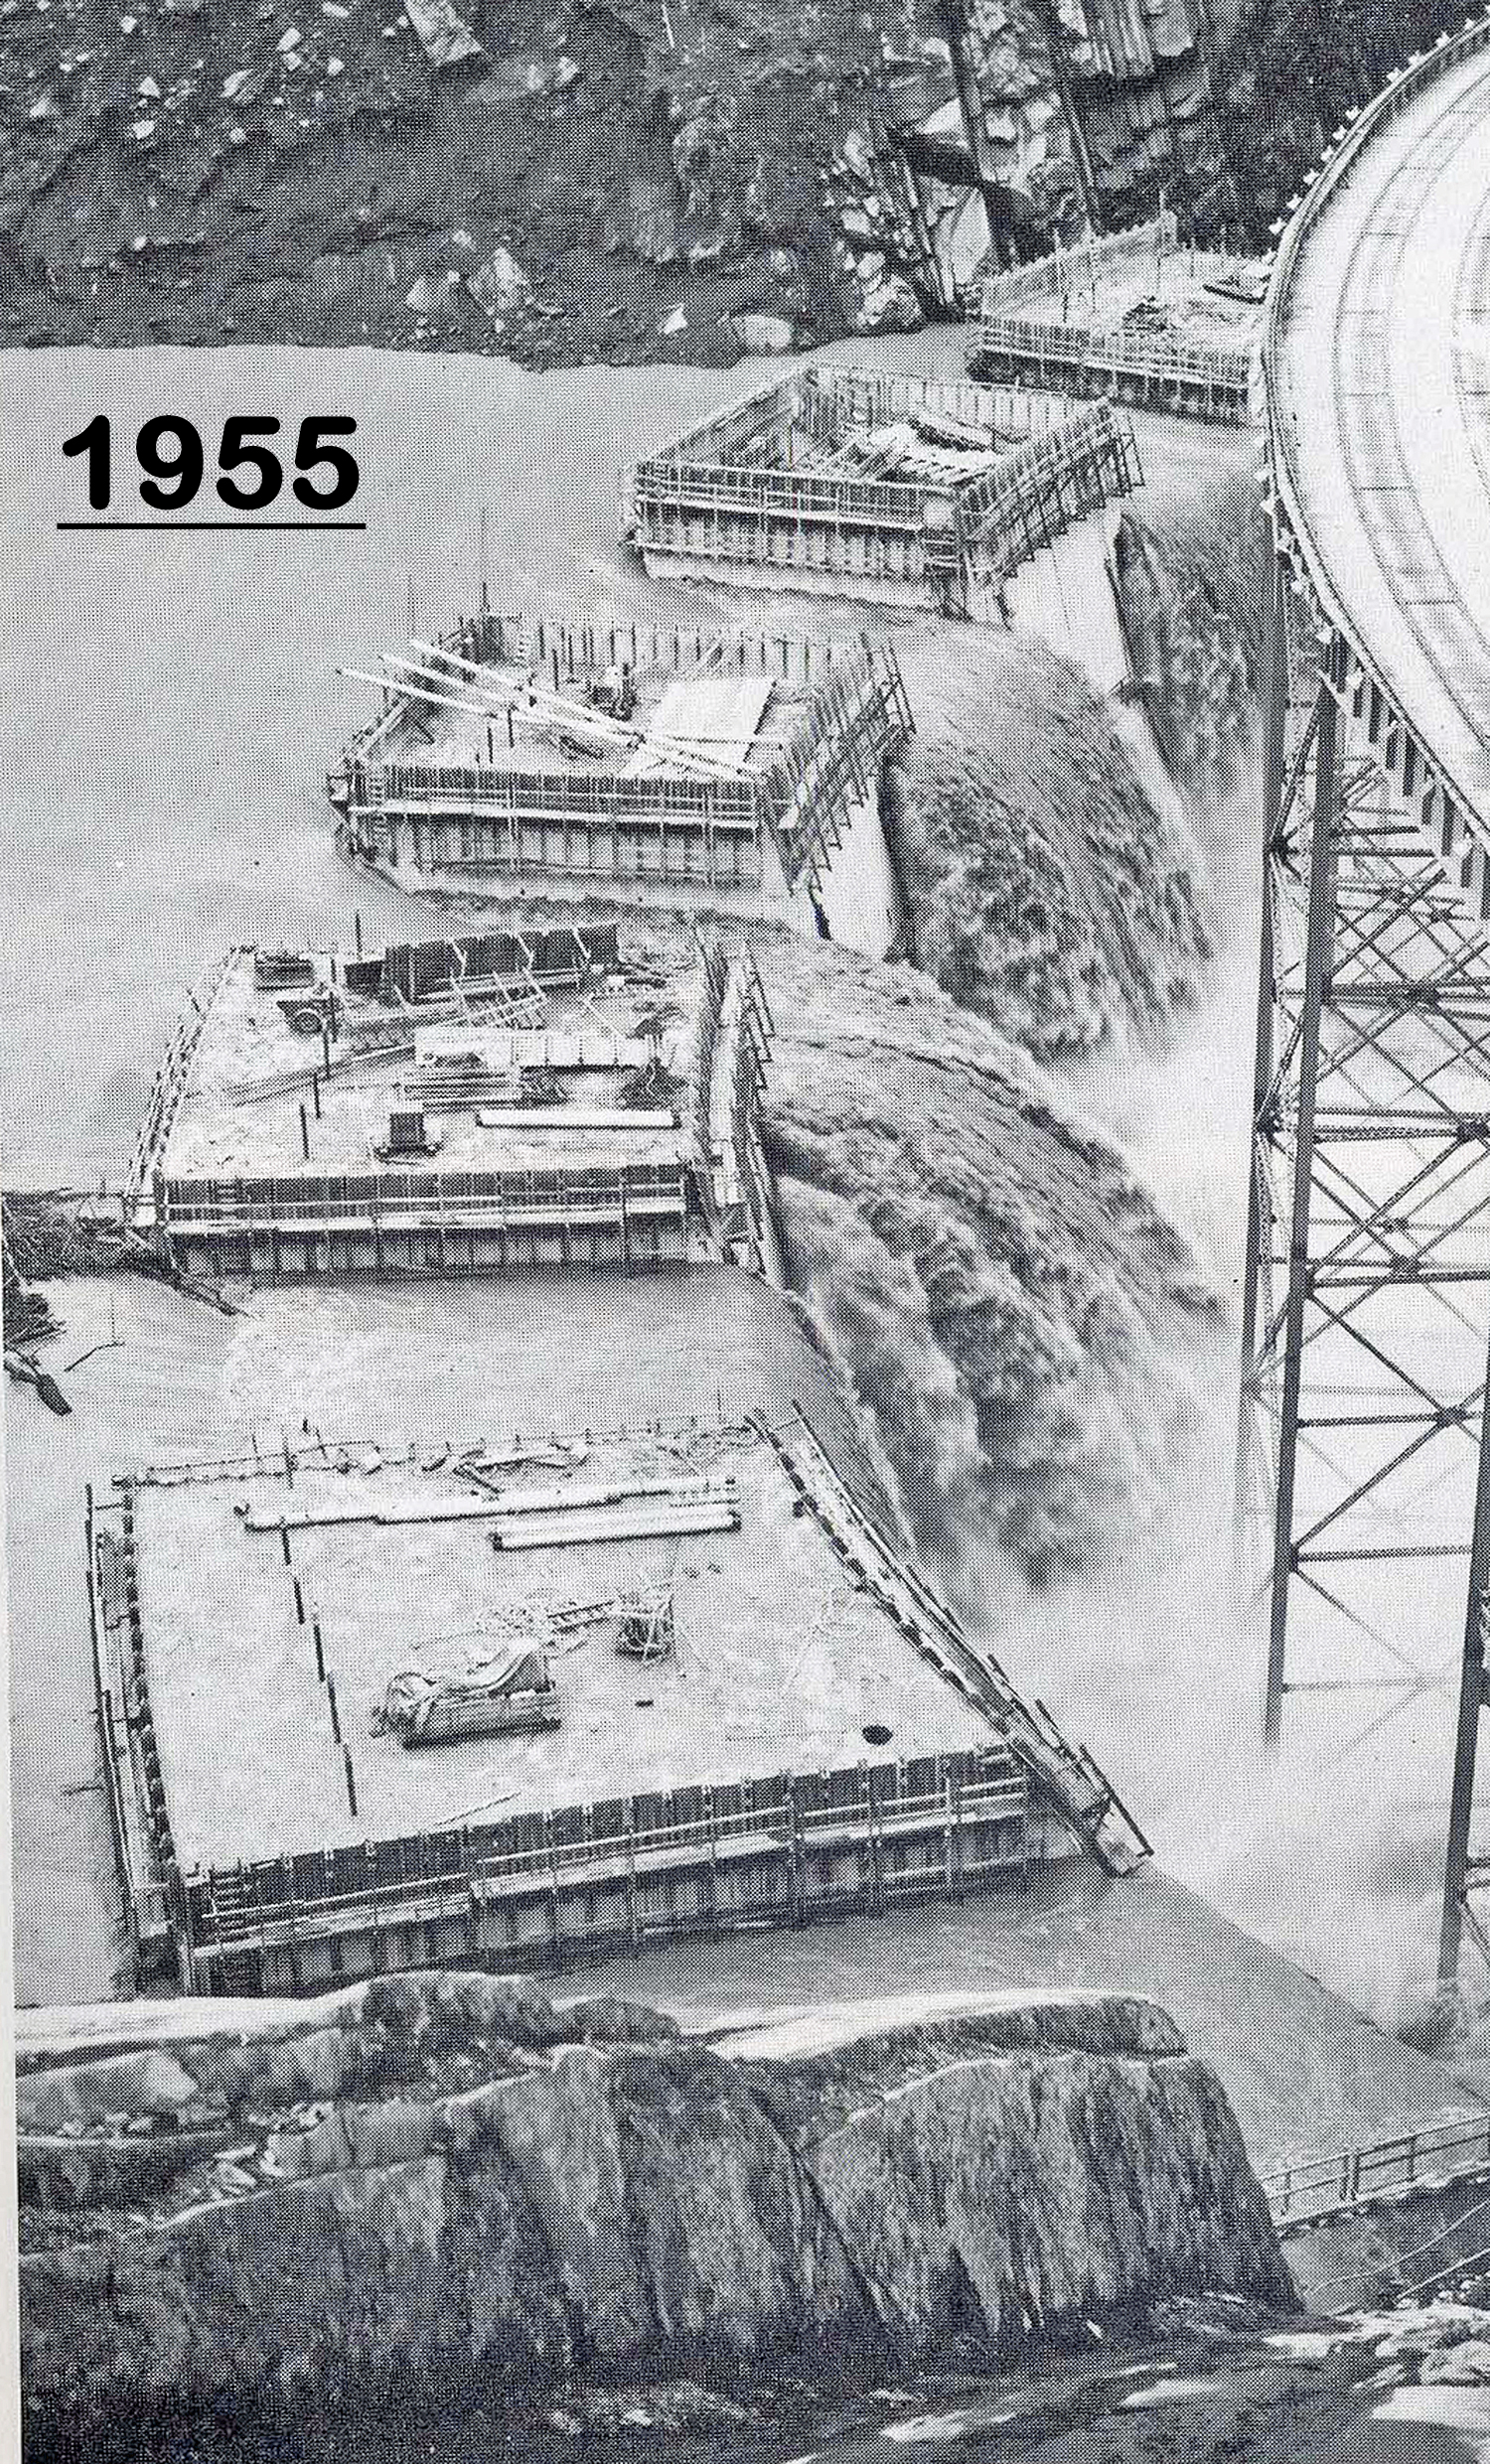
During the construction phase, Lake Berryessa did rise high enough to spill over the top of the dam when it was at about half its finished height, causing damage and delays.
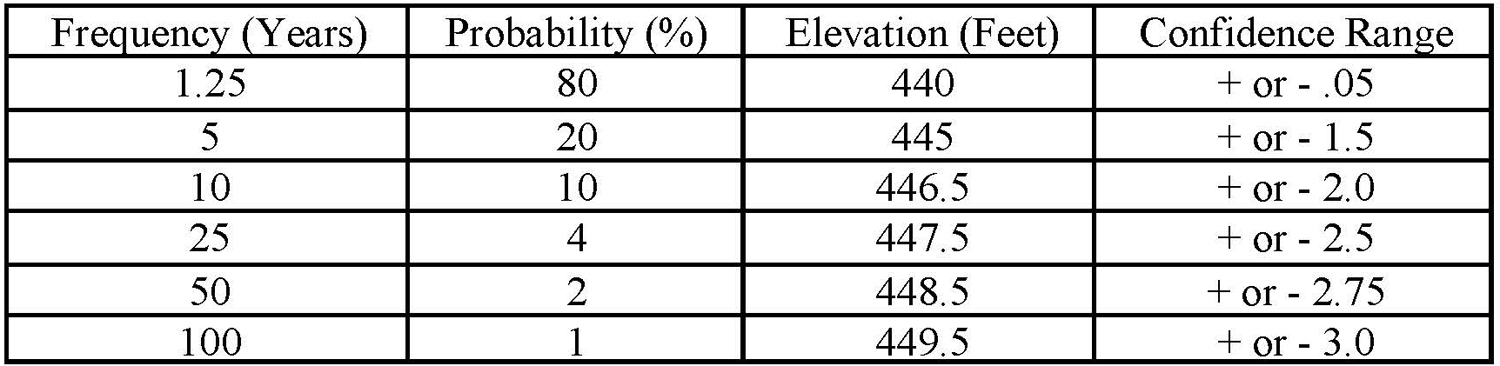
The Bureau of Reclamation did a Flood Elevation Probability Study in 1986. Although this is a bit of statistical game-playing, it is interesting to see the worst-case scenarios and the probability of their occurrence. Flood flows in this study were assumed to start at the initial elevation of 440 feet. All the frequency floods used in this study had a duration of 7 days. In other words, if the lake were already at 440 feet and then the various rainfall levels and flood flows (5-yr, 10-yr, 25-yr, 50-yr, 100-yr) began and lasted for 7 days, how bad could it get?
The impact of the 1984 Probable Maximum Flood flow produced a water surface elevation of 463.7 feet, or 7.7 feet ABOVE the dam for several days. This level was assumed to be the maximum reservoir elevation that could ever be reached during a flood. A related note in the study said, “Monticello Dam was assumed not to fail.”
Not to worry too much since this worst-case scenario had a VERY low probability – somewhere between 10,000 and 1,000,000 years. Even the probability of the lake reaching the top of the dam at 456 feet was very low with a 5% confidence limit of 417 years recurrence and 95% confidence limit of 16,667 years recurrence. As stated in the study, “computed probabilities beyond a 100-year recurrence are not considered to be reliable; therefore, only confidence limits are provided. There is a 90% probability of a specific event occurring somewhere in the interval between confidence limits.”
The following table, based on an analysis completed in 1986, depicts the water elevation that, on the average, may be reached or exceeded for various time periods.
Flood routing studies indicate the Probable Maximum Flood (PMF) would overtop the dam parapet walls by six (6) feet (elevation 462') for 51 hours. Floods equal to or larger than 80 percent of the PMF will overtop the dam. Such overtopping is not expected to affect the safety of the dam. The Reservoir Floodplain, from elevation 440 feet to 455 feet, can be encroached at various times.
A 90% probability sounds high, but would you place a “sure bet” that the lake would hit 463.7 feet, 7.7 feet above the dam, if you had to wait somewhere between 400 and 16,000 years to collect?

The frequency floods derived for Lake Berryessa were developed using USGS stream gage records at Putah Creek near Winters for water years 1931 through 1956, and Bureau of Reclamation computed inflows to Lake Berryessa, for water years 1957 through 1986. The Putah Creek flows near Winters were assumed to be representative of the flows at Monticello dam site for water years 1931 through 1956.
The above records were analyzed to determine the relative frequency of the highest mean daily flows greater than 2,660 Cubic feet per second (CFS) for the following number of consecutive days , 1, 2 , 3 , ... , 20 or more. The flow of 2,660 CFS is the discharge capacity of Monticello Dam at elevation 440 feet. It was assumed that mean daily inflows less than this could be released without increasing the water surface elevation of Berryessa Reservoir. This analysis determined that 90 percent of all consecutive mean daily inflows greater than 2,660 CFS for water years 1931 through 1986 were of 7 days duration or less.
An annual frequency analysis was performed on the highest consecutive 1-day, 3-day, 5-day, and 7-day flows for the period of record.
The 1984 flood study for Lake Berryessa provided the frequency flood peak discharges which were used in conjunction with the computed 1 day, 3-day, 5-day, and 7-day frequency flows to derive the symmetrical synthetic 100-year, 50-year, 25-year, 10-year, and 5-year frequency floods for Lake Berryessa. All the frequency floods developed for this study have a duration of 7 days.
All frequency floods routed in this study were started at lake elevation 440 feet which is the top of active conservation pool and the recommended elevation to begin routing all floods. The initial elevation of 440 feet, which is a conservative estimate of the reservoir water surface elevation at the start of a flood, is also the crest elevation of the uncontrolled Glory Hole spillway.
The maximum reservoir water surface elevations reached when routing the 100, 50, 25, 10, and 5-year frequency floods through Berryessa Reservoir were plotted on Arithmetic Probability paper and a probability curve was drawn through the respective points. The probability curve was then extended below tile 5-year return period to the point where it intersects water surface elevation 440 feet by linear extrapolation.
The upper and lower confidence limits between the 5-year and 200-year floods were defined by developing the 5-year and 200-year floods at the upper and lower confidence limits and routing the four floods through the reservoir. The upper confidence limit curve was more clearly defined by developing the 50-year upper confidence limit flood and routing it through the reservoir.
In order to extend the upper and lower confidence limits beyond the 200-year flood the 1984 Probable Maximum Flood was routed through the reservoir and the maximum water surface elevation reached was used to define the maximum elevation. A line was drawn between the upper confidence limit at the 200-year flood and elevation 463.7 feet at the 10,000-year return period (.01 percent probability). The same process was repeated extending the lower confidence limit to elevation 463.7 feet at the 1,000,000-year return period (0.0001 percent probability). The method described to the extend the confidence limits beyond the 200-year flood is recommended by the Engineering and Research Center for use in developing peak discharge probability curves and was assumed to be applicable to this study.
In order to define the portion of the upper and lower confidence curves below the 5-year return period the following method was used. At the point where the probability curve intersects water surface elevation 440 feet, the upper and lower confidence limits were assumed to be plus or minus 0.5 feet above and below the computed curve. The confidence limit curves were then assumed to be linear between these two points and the 5-year return period upper and lower confidence limits.
The probability curve developed in this study and shown on the graph can be used to assess the risk of development within Lake Berryessa's surcharge zone (elevation 440 feet to 455 feet).
Overbank flooding along lower Putah Creek has been eliminated since 1957 after construction of the Monticello Dam at Lake Berryessa and levees along the lower nine miles of the channel, and due to channel incision caused by construction of the Putah South Canal. Modeling of the 100-year storm event when Lake
Berryessa is full showed that flood flows of 32,200 CFS would pass the community of Winters. For comparison, there were three floods recorded before construction of the dam that peaked from 67,200 to 81,000 CFS in the same area. (Yolo County Water Resources Association 2004)