
Lake Berryessa News
July 26, 2026
________________________________________________________________
Lake Berryessa Statistics (7/27/26)
Lake Berryessa water level continues to drop about a half inch per day as the growing season advances into summer. It now stands at 433.0 feet - 7 feet below Glory Hole.
The lake output has risen to an average of 600 cfs (1,269 A-F per day).
Lake capacity is now at 1,421,487 Acre-Feet or 91.6%.
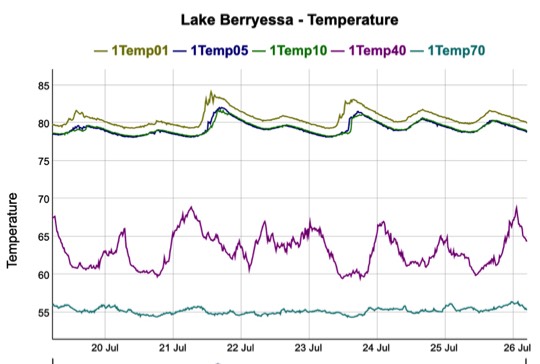
Water temperature is averaging 80 degrees at the surface and a constant 55 degrees at 70 feet.
_____________________
______________________________________________________________________________
Camp Margaritaville Resorts at Steele Canyon Recreation Area - Update
Onward with the Lake Berryessa Revitalization Program!
After news stories with allegations of wrong doing and responses refuting those allegations with detailed documentation of innocence, things have quieted down. Two follow-up statements have been released.
From Tim Wilkens: "It is also important to note that this litigation is after doing over 1,000 real estate developments and acquisitions!"
From Napa County: "Per our conversation on July 9th of 2026, this email confirms that you are “back on the clock” regarding the allowable timeline in your Exclusive Negotiating Agreement (ENA). Should you choose to timely ask for the allowable 6 month extension available to you, that would mean, by our calculation, the ENA will expire in July 2027.
This includes the time we allowed you to be on hold pursuing the extension terms with the BOR. Absent further extensions, by July 2027 you should be finished with all the work in the ENA needed to enter into a long term concessions agreement, regardless of your current negotiations with the Federal Government for a longer lease."
______________________________________________________

______________________________________________
Spreading the Ashes
I received some interesting stories from folks who had spread their loved one's ashes. Most did not know about the law, or just ignored it. Here are a few.
"I spread my brother’s ashes from my boat upstream from Party Cove during the week when nobody was around, just me and family. I guess I’m a law breaker now."
"I spread my father's ashes off the Golden Gate Bridge with no interference."
"My friend kept his father's ashes in the back of his pick-up bed. Unfortunately, when he made a sharp turn, the urn flew out of the truck and spread the ashes all over the road."
"I'm helping spread my brother's ashes, and his wife's in Santa Barbara harbor. My niece worked our the permitting."
"As the pilot in my family, I asked my mother and my brother to allow me to spread my father's ashes over a prominent landmark on his ranch known as Knoxville Ridge."
"I had my mother's ashes in a small building above Lake Berryessa. When the last big fire almost burned down my house, it did burn the storage building. The fire destroyed everything, including my mother's urn - leaving only a big pile of mixed ashes. My mother had a double cremation."
_________________________________________________

_____________________________________________
10 Common Phrases (Almost) Everyone Gets Wrong
If mistaken words are used often enough, people start to repeat and transmit them in different forms. Here are some of the most common idioms that people mishear and misunderstand.
The one I really hate is "between you and I". Some people may think that makes them sound smart when it makes them sound stupid.
The correct English usage "between you and me". You never hear someone say, "between we" when the correct English usage is "between us".
If you hear Taylor Swift singing about “all the lonely Starbucks lovers” on “Blank Space,” that’s a mondegreen, which is a misheard lyric that gets repeated so often, it becomes almost as ubiquitous as the correct version (“got a long list of ex-lovers,” in Taylor’s case). The same thing happens with common idioms and phrases.
Examples of Mondegreen in a sentence
"Singing along with Hendrix, she belted out the mondegreen "Excuse me while I kiss this guy.""
Did you Know?
The word mondegreen is actually the result of a mondegreen itself. It stems from the misinterpretation of an old Scottish ballad lyric, "laid him on the green," which became "Lady Mondegreen."
Did a 360
Double-check your math on this one. There are 360 degrees in a circle, so performing a 360-degree revolution will land you back exactly at the beginning. Perhaps you meant that, but if you’re implying that you made a great change, the correct version is “did a 180.” In that case, you left your starting point to move as far away as possible. In other words, you completely shifted yourself, either metaphorically or physically.
Escape Goat
The word you’re looking for here is most likely “scapegoat.” This translation of a biblical phrase refers to a person or thing that can be blamed for the mistakes of others. An “escape goat” might be found if livestock gets loose on a farm, but it’s not a common idiom.
First-Come, First-Serve
The proper way to write this phrase is “first-come, first-served.” One little letter might not seem like a big deal, but “served” indicates that whoever arrives first will be waited on first. The “serve” variation implies the first guest to come will serve all the other guests, which would likely be an unwelcome surprise.
For All Intensive Purposes
The correct idiom — “for all intents and purposes” — comes from 16th-century English law as the longer phrase “to all intents, constructions, and purposes.” Essentially, it means “practically” or “in effect.” This is an example of an eggcorn, or a phrase people mishear and alter over time.
Hunger Pains
The original phrase is “hunger pangs,” although “pains” could technically be correct as well. The former is an older term that refers to the feeling of cramping that comes with an empty stomach. Since the word “pangs” is a bit outdated, it’s sometimes mispronounced as “pains,” though they essentially refer to the same idea.
I Could Care Less
This one stirs up a bit of debate. When the words are parsed out individually, the accurate version to imply that you care a minimal amount is “I couldn’t care less.” However, the American colloquialism of “I could care less” is so widely used that even dictionaries have accepted it.
Nip It in the Butt
While the thought of getting bit on the butt is pretty funny, the correct phrase is “nip it in the bud.” This idiom comes from the world of gardening. If you trim a plant while it’s in the budding stage, it won’t grow properly. That’s precisely what you might want to do with a dangerous idea or rumor — nip it right in the bud.
On Tender Hooks
While you might feel a little tender while nervous or tense, the correct version of this expression is “on tenterhooks.” These hooks were used to stretch fabrics, and that stretching concept was extended to feelings of anxiety or worry. “Tender hook” is just a mispronunciation of the real term.
Pass Mustard
“Pardon us. Do you have any Grey Poupon?” Forget that popular commercial — while you might ask someone to “pass the mustard” at the dinner table, the correct wording for the idiom meaning “to gain approval or acceptance” is “pass muster.” It comes from the military term “muster,” which describes a formal inspection.
You’ve Got Another Thing Coming
As with “could care less,” this alternative phrase has almost replaced the original, which is “you’ve got another think coming.” In other words, you’re wrong and must rethink what you’re saying or doing. The “think” version of the phrase is older and more likely to be used by British English speakers.

________________________________________________________
_____________________________________________________________________
________________________________________________
Five Lake Berryessa resorts are open.
Spanish Flat Campground: https://campspanishflat.com/
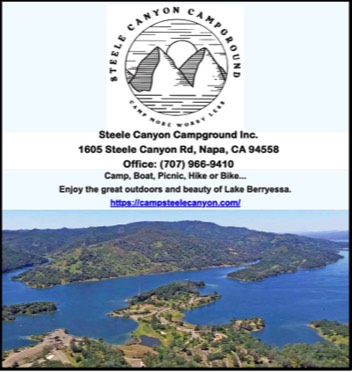
Steele Canyon Campground: https://campsteelecanyon.com/
Pleasure Cove Marina: https://goberryessa.com/
Markley Cove Resort: https://markleycove.com/
Putah Canyon Campground: https://royalelkparkmanagement.com/putah-canyon
____________________________

___________________________________________

__________________________________________________________
____________________________________________

_____________________________________________________________________
_____________________________________________________________________
_______________________________________________________________________
____________________________________________________________________
____________________________________________________________________
____________________________________________________________________
__________________________________________________
_________________________________________________
_________________________________________________

____________________________________________________________________
Track the real-time Lake Berryessa weather at:
Skiers Cove (Below the Berryessa Highlands)
Skier Cove - KCANAPA228
https://www.wunderground.com/dashboard/pws/KCANAPA228
East Side Road (Across from Big Island)
East Side Road, Lake Berryessa - KCALAKEB2
https://www.wunderground.com/dashboard/pws/KCALAKEB2
Spanish Flat (Near the Spanish Flat Recreation Area)
Roger - KCASPANI1
https://www.wunderground.com/dashboard/pws/KCASPANI1
Berryessa Pines
KCANAPA461
https://www.wunderground.com/dashboard/pws/KCANAPA461

________________________________________________________________

__________________________________________________________________
Lake Berryessa Fire Watch Cameras
This site covers the whole Lake Berryessa Region.
http://www.rntl.net/lake-berryessa-cams/
_________________________________________________
Press Democrat: Camp Margaritaville Resort at Steele Canyon
____________________________________________________________
Free Book Chapters Available For Download
My sincere thanks to those of you who contributed to the future of the Lake Berryessa News. I challenge you to find any Lake Berryessa news anywhere. Hopefully, the many years of our intensive reporting about the latest Lake Berryessa issues will convince you of the truth of our motto, "Without The Lake Berryessa News there would be no Lake Berryessa news".
Here's a gift from The Lake Berryessa News to my readers - Free downloadable chapters from my books:
The Death of a Valley
Why Does Lake Berryessa Exist?
The Lake Berryessa Watershed
Rainfall and Lake Level History
How High Is Lake Berryessa?
How Deep is Lake Berryessa?
How Much Water Does Lake Berryessa Hold?
Mean Sea Level: Is There Such A Thing As Accurate Height?
Water In, Water Out, But From Where?
Does the WALROS Like Lake Berryessa?
Why is Lake Berryessa Not a Part of the Berryessa Snow Mountain National Monument?
East Side Story
Hiking and Wildlife Viewing
Are There Quail on Quail Ridge?
Why Does A Hiker Cross The Road? To Get To Stebbins Cold Canyon!
Private Houseboats - Yes; Private RVs & Trailers - No: Why?
Motorized Boats Banned From Big Island Lagoon! Why!
Archeologists Can't Dunk But Can Dig
What Can't You Do At Lake Berryessa?
Napa Opposes Building the Monticello Dam
Monticello Dam Construction
Raise Monticello Dam
Power Generation at Monticello Dam
Monticello Dam Failure Analysis
Predicting the Future & Glory Hole Drone Videos
As Lake Berryessa Turns!
The Ins and Outs & Ups and Downs of Lake Berryessa
Does Lake Berryessa Sweat in the Summer?
Glory Hole Introduction
How Does Glory Hole Work?
Glory Hole: Awesome, Frightening, But Dangerous?
_____________________________________________
________________________________________________________________________________-
Lake Berryessa Political History (Free Downloads of Book Chapters)
Policy And Politics Betray The People: The Lake Berryessa Saga: 1958 - 2020, By Peter Kilkus
I. The Five Tragedies Of The Berryessa Valley: A History Of Heartbreak
II. Lake Berryessa Political History Timeline
III. The “Big Lie”: How It All Began
IV. The “Big Fail”: Napa Abandons Lake Berryessa (1975)
V. The “Big Picture”: Lake Berryessa Issues: 1957 - 2012
VI. The “Big Illusion”: Notice Of Intent
VII. The “Big Fight”: Facts Do Matter
VIII. The “Big Betrayal”: Perversion Of Public Law 96-375
IX. The “Big Mistake”: Pensus - The Beginning Was The End!
X. The “Big Hole In History”: Post-Pensus Blues
XI. The “Big Boondoggle”: Creation Of A Phony National Monument
Addendum 1. Dueling Napa Register Letters To The Editor
Addendum 2. The Napa Register View
Index Of Primary Documents
_______________________________________________________________
______________________________________________________
__________________________________________________________
_________________________________________________________________________________

_________________________________________________________________________________

_________________________________________________________________________

__________________________________________________________________________________________________
Lake Berryessa Technical Manual: The Science, Engineering, History, and Humor of a Major Unnatural Resource
https://www.amazon.com/Lake-Berryessa-Technical-Manual-Engineering-ebook/dp/B0C21DZ9M9/ref=sr_1_3?
************
Policy and Politics Betray the People: The Lake Berryessa Saga: 1958 - 2020
https://www.amazon.com/Policy-Politics-Betray-People-Berryessa-ebook/dp/B08MFSQDBR/ref=sr_1_1?
************
Conspiracy Theory or Automatic Pilot: The Economic Roots of Environmental Destruction
https://www.amazon.com/Conspiracy-Theory-Automatic-Pilot-Environmental/dp/1676368302/ref=sr_1_3?
************

The KPIX Eye on the Bay interview below is one I did in 2010 and a relevant introduction to the substance of the book. I did it after Pensus had been given the contract for 5 resorts. As we all know Pensus was subsequently kicked out in 2012.

___________________________________________________________________________________
Lake Berryessa Data Sources
There are many sources of Lake Berryessa water and weather conditions available. The Solano County Water Agency site is good for real-time graphs of level, capacity, and water temperature. The California Data Exchange Center has data going back decades for level, capacity, capacity change, dam outflow, dam inflow, and rainfall. Anyone can research their own data and create custom charts. This is the source of many of the charts on the Lake Berryessa News website.
********
An upgraded wildfire alert camera system will be keeping watch on Napa County day and night and notifying Cal Fire crews of potential fires. Twenty cameras will be part of a system that will use artificial intelligence and other technologies to identify fire and smoke. If they detect something, an alert will sound in the Cal Fire emergency command center near St. Helena.
Cal Fire has made a large investment into the ALERTCalifornia system, partnering with UC San Diego. There are 1,000 cameras across the state and Napa County is one of the test models. Cameras can see 60 miles during the day, and this can increase to 120 miles on clear nights, with the changes in the air. The system can differentiate among smoke, clouds and dust. A link to this camera system and other relevant weather data is available on the Lake Berryessa News website at: http://www.rntl.net/lake-berryessa-cams/
This website was created by Doug Kunst. It is an amazing resource for Lake Berryessa fire cameras and weather. His business website is http://www.rntl.net/
Lake Berryessa Fire Alert Cameras
http://www.rntl.net/lake-berryessa-cams/
********
Real-Time Lake Level, Lake Capacity, Water Temperature
Solano County Water Agency
https://www.scwamonitoring.com/LakeBerryessa/
*********
Lake Detailed Historical Data
California Data Exchange Center
https://cdec.water.ca.gov/
Research historical data and create custom plots
Lake Berryessa Code: BER
https://cdec.water.ca.gov/dynamicapp/sensorplots?staid=ber&dur_code=D
******
Local Weather Stations (Weather Underground Network)
Skiers Cove (Below the Berryessa Highlands)
Skier Cove - KCANAPA228
https://www.wunderground.com/dashboard/pws/KCANAPA228
East Side Road (Across from Big Island)
East Side Road, Lake Berryessa - KCALAKEB2
https://www.wunderground.com/dashboard/pws/KCALAKEB2
Spanish Flat (Near the Spanish Flat Recreation Area)
Roger - KCASPANI1
https://www.wunderground.com/dashboard/pws/KCASPANI1